1. The Pre-Production Blindspot
Standard pre-production continuous integration pipelines answer a single binary question: Do unit and functional integration tests pass? They rarely show how a pull request behaves when ten, fifty, or hundreds of concurrent requests contend for database connections, application locks, or shared cache lines.
When performance regressions bypass CI into staging or production, engineers are forced into fragmented manual triage: load-generation scripts run locally, dashboard charts are scanned manually, and log aggregation tools are searched for error signatures. If a code fix is proposed, it is seldom re-evaluated under identical load parameters alongside correlated server telemetry.
Client-side load metrics alone are symptoms. Without correlated server-side telemetry from traces and logs, client metrics can invert reality—interpreting a high-rate cascade of fast HTTP failures as a latency improvement.
TraceForge was designed to turn code changes into governed, telemetry-validated experiments. Given a target repository and two Git revisions (base and candidate), TraceForge scopes affected endpoints, runs budgeted k6 load scripts in detached Git worktrees, queries server-side telemetry via the SigNoz Model Context Protocol (MCP) server, deterministically classifies regressions, generates scope-checked patches, and re-tests remediations before issuing a release verdict.
2. The Case Study That Driven the Design: SQLite Write-Lock Contention
To illustrate why server telemetry correlation is mandatory, consider a real execution of TraceForge on scenario a2a7d676-038f-4e3c-8fd5-10cc3b8246b7 (executed on July 25, 2026, against live SigNoz Cloud with OTLP ingestion).
In this scenario, a candidate revision modified a SQLite write handler, introducing severe database lock contention. Below is the raw client metric comparison recorded during the experiment:
| Measurement Metric | Baseline Phase | Candidate Phase | Patched Phase |
|---|---|---|---|
| Total Completed Requests | 5,042 | 6,740 | 5,486 |
| Throughput (req/s) | 86.87 | 116.06 (+33.6%) | 94.52 |
| P50 Latency (ms) | 48.89 | 110.36 | 47.49 |
| P95 Latency (ms) | 713.40 | 364.11 (-48.96%) | 607.55 |
| P99 Latency (ms) | 2,758.95 | 444.80 (-83.88%) | 2,453.45 |
| HTTP Failure Rate (%) | 0.18% | 94.55% | 0.07% |
A standard latency dashboard would display the candidate phase in bright green: P95 latency dropped by 48.96% (364.11 ms vs 713.40 ms) and throughput rose by 33.6% (116.06 req/s vs 86.87 req/s).
However, this improvement is a complete illusion. P95 dropped and throughput rose because 94.55% of candidate requests failed immediately with HTTP 500: database is locked without executing the database write logic.
TraceForge evaluates error concentration first. It queries SigNoz MCP for server-side log strings and span attributes during the candidate window, correlates the database is locked logs, classifies the outcome as DATABASE_CONTENTION / ERROR_RATE_REGRESSION, flags candidate latency improvements as misleading, and generates a scoped patch. Only after verifying the patched phase (0.07% failure rate at 607.55 ms P95) does it issue a SHIP verdict.
3. System Architecture & Deterministic Workflow
TraceForge is structured as a FastAPI orchestrator service, CLI runner, Next.js control room UI, and Python SDK interfacing with Git, k6 subprocesses, and the official SigNoz Model Context Protocol (v0.9.0) server.
The orchestrator enforces a legal state machine with 16 operational stages leading to 5 terminal verdict states:
class Stage(StrEnum):
    CREATED = "CREATED"
    REPOSITORY_VALIDATED = "REPOSITORY_VALIDATED"
    CHANGE_INSPECTED = "CHANGE_INSPECTED"
    ENDPOINTS_SCOPED = "ENDPOINTS_SCOPED"
    LOAD_PLAN_CREATED = "LOAD_PLAN_CREATED"
    K6_SCRIPT_VALIDATED = "K6_SCRIPT_VALIDATED"
    BASELINE_COMPLETED = "BASELINE_COMPLETED"
    CANDIDATE_COMPLETED = "CANDIDATE_COMPLETED"
    TELEMETRY_CONFIRMED = "TELEMETRY_CONFIRMED"
    SIGNALS_CORRELATED = "SIGNALS_CORRELATED"
    REGRESSION_CLASSIFIED = "REGRESSION_CLASSIFIED"
    PATCH_PROPOSED = "PATCH_PROPOSED"
    PATCH_AUDITED = "PATCH_AUDITED"
    PATCH_SANDBOXED = "PATCH_SANDBOXED"
    VERIFICATION_COMPLETED = "VERIFICATION_COMPLETED"
    VERDICT_PUBLISHED = "VERDICT_PUBLISHED"

class TerminalState(StrEnum):
    PASSED = "PASSED"
    BLOCKED = "BLOCKED"
    NEEDS_REVIEW = "NEEDS_REVIEW"
    FAILED = "FAILED"
    CANCELLED = "CANCELLED"
Every transition is idempotent and stored in SQLite alongside a per-run SHA-256 hash-chained JSONL audit ledger. If SigNoz credentials or telemetry correlation fail, the state machine halts at NEEDS_REVIEW with the message “SigNoz verification unavailable” and refuses to issue a SHIP verdict.
4. Visual System Diagrams
The flow of execution across boundaries is illustrated below:
5. Latency-Adjusted Throughput Expectation
When executing closed-loop load tests with a fixed schedule of virtual users (VUs), client concurrency is constrained. Consequently, total throughput (req/s) is mechanically bound to target response latency. If candidate P50 latency increases, request throughput drops naturally even if no independent throughput capacity bottleneck exists.
Early prototypes of TraceForge flagged harmless latency increases as dual regressions (both latency and throughput). To eliminate false positives, TraceForge computes the latency-adjusted throughput expectation based on Little's Law relationships:
def latency_explained_rate(baseline: MetricStats, candidate: MetricStats) -> float | None:
    """Throughput the candidate must reach if only its latency changed.

    The k6 plan is a closed-loop ramping-VUs schedule, so both phases run the same
    concurrency curve and throughput is a dependent variable of latency. A rate drop
    that matches the latency rise therefore repeats the latency comparison instead of
    adding an independent signal.
    """
    if baseline.p50_ms <= 0 or candidate.p50_ms <= 0:
        return None
    return baseline.rate * (baseline.p50_ms / candidate.p50_ms)
If a candidate throughput drop stays within 20% of latency_explained_rate, TraceForge marks the throughput drop as latency-explained rather than asserting an ungrounded THROUGHPUT_REGRESSION.
6. Agent Self-Observability & Live SigNoz Telemetry Screenshots
TraceForge instrumented its own orchestrator workflow using OpenTelemetry. When investigating a target application, TraceForge exports internal orchestration spans to SigNoz under service name traceforge-orchestrator.
In a recorded lock run (Run ID 50ef7693-1eb8-4050-8ae8-1de5c76f83b2), the orchestrator emitted 16 distinct span names and 33 MCP tool spans (spans named signoz.mcp.call tagged with traceforge.mcp.tool and traceforge.run.id).
Empirical Telemetry Artifacts from Live SigNoz Cloud
Below are real dashboard screenshots captured during live OTLP ingestion runs on July 25–26, 2026:
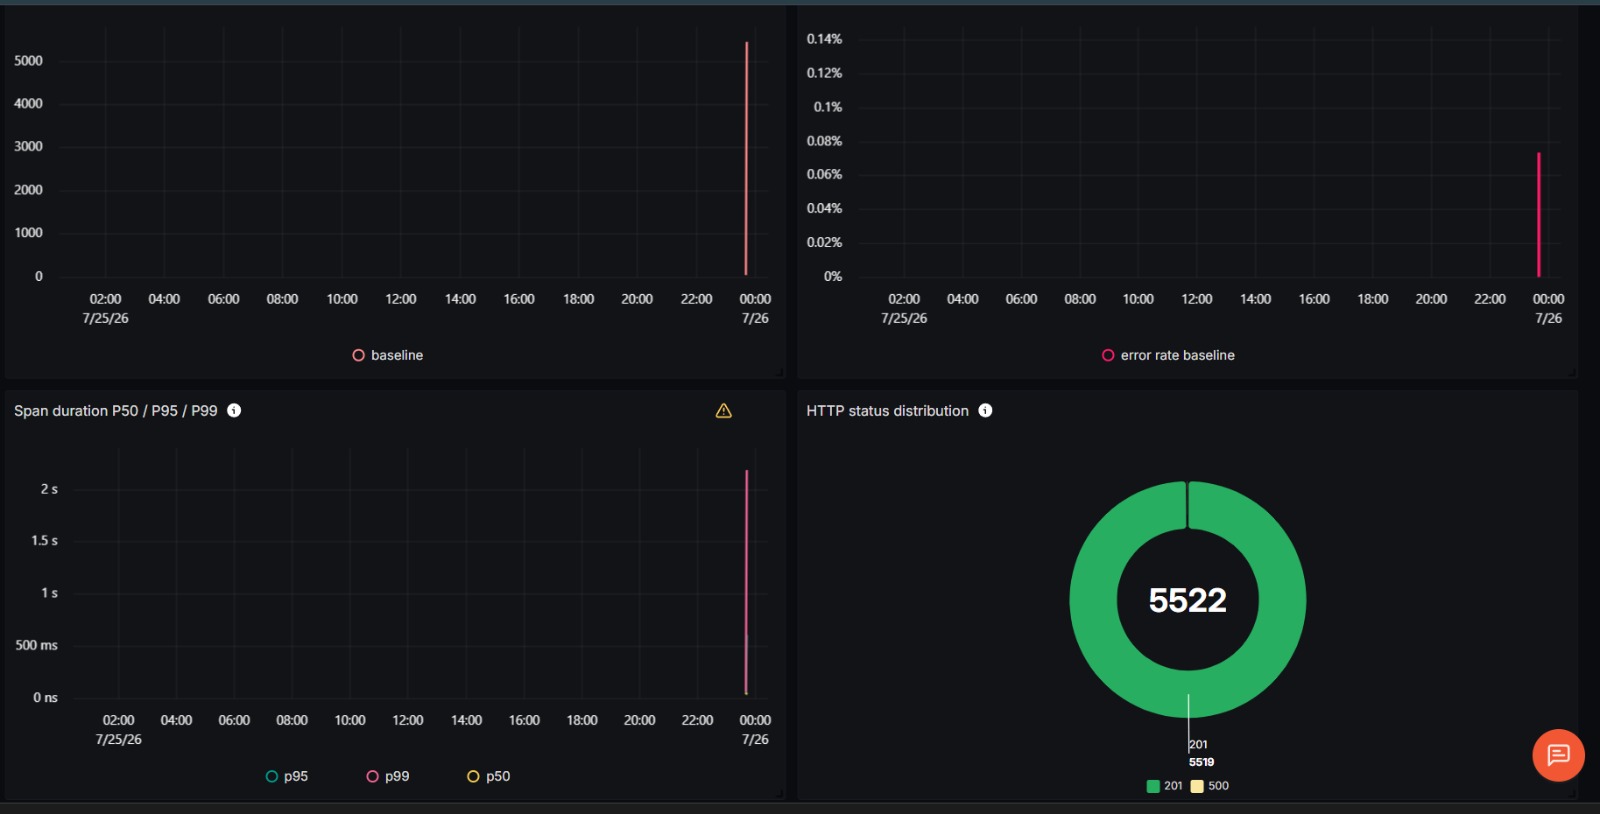
POST /api/visits during the baseline phase showing uniform latency distribution and 0% database lock errors.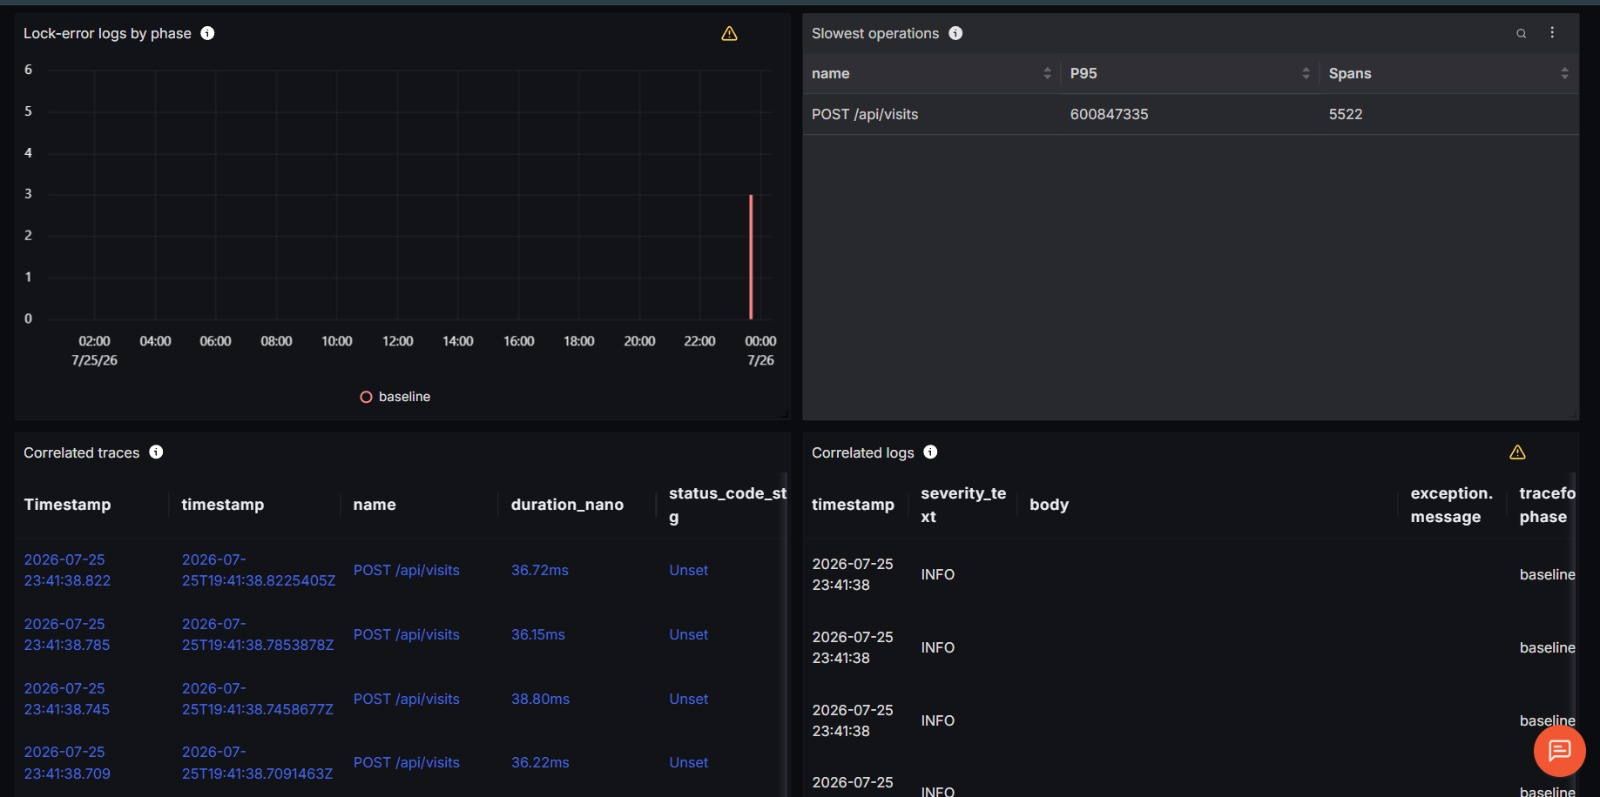
verification.execute P95 6.9s, k6.execute P95 5.9s, signoz.preflight P95 1.4s) and MCP tool call frequency.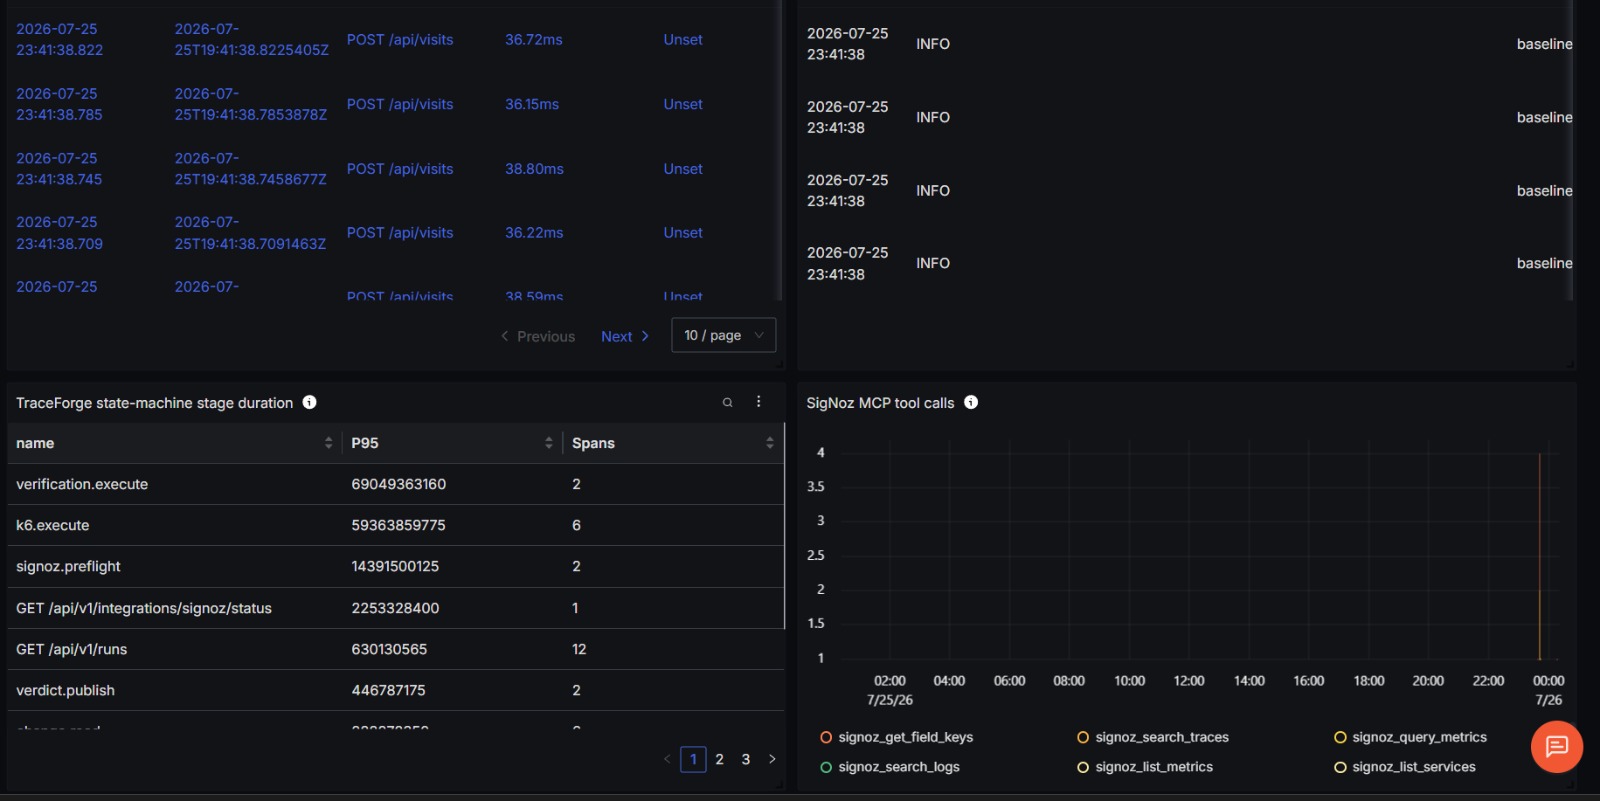
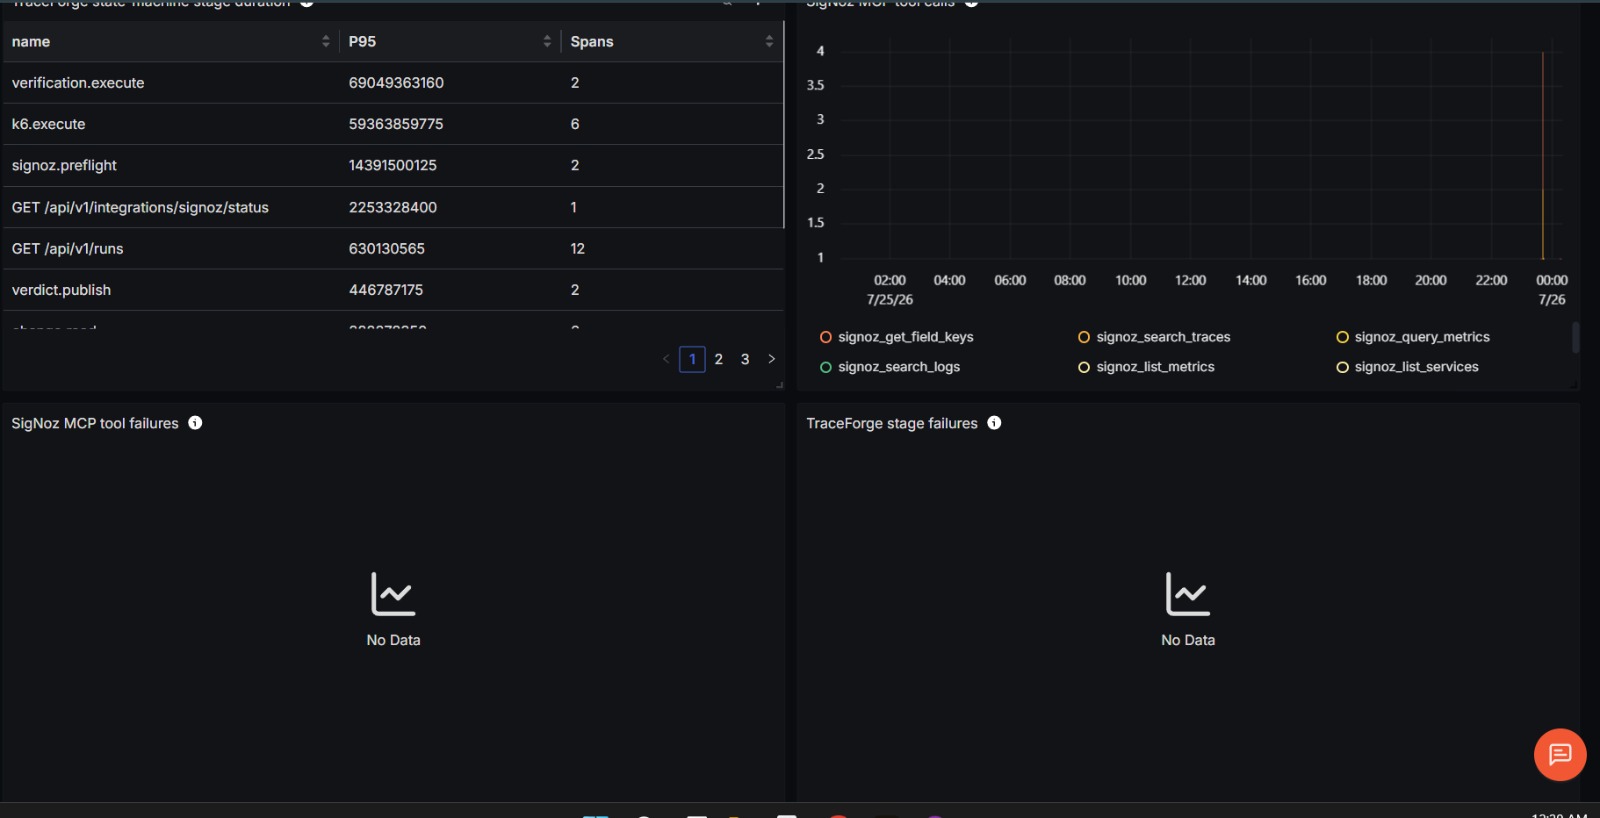
This design ensures that the reliability agent itself is fully auditable in the exact telemetry platform it queries, without polluting the target application's service metrics.
7. Tamper-Evident Hash Chain Ledger
Every state machine transition appends a canonical JSON record to a per-run ledger file (ledger.jsonl). Each event includes a SHA-256 hash calculated over its payload and the previous event's hash, forming a cryptographic chain rooted at a genesis hash.
def calculate_event_hash(previous_hash: str, event_without_hash: dict[str, Any]) -> str:
    payload = previous_hash + canonical_json(event_without_hash)
    return hashlib.sha256(payload.encode("utf-8")).hexdigest()
Tamper Test Verification: In automated tests (tests/unit/test_ledger.py), altering a single byte of an event payload (e.g., flipping one character in output_digest on event 9) causes AuditLedger.verify() to return valid: false with event 9: event hash mismatch, while untouched run ledgers verify clean.
8. Empirical Benchmark Matrix
Below are empirical measurements recorded on July 25, 2026, across three core scenarios executed against live SigNoz Cloud:
9. Security & Sandbox Execution Controls
TraceForge does not claim "production-grade security" or "unbreakable isolation." Instead, it implements concrete, auditable security controls:
- Path Allowlisting: Local target repos must resolve beneath explicitly listed roots in
TRACEFORGE_ALLOWED_REPO_ROOTS. - Host Allowlisting: Target execution hosts must match allowlisted patterns in
TRACEFORGE_ALLOWED_TARGETS. - Subprocess Execution: All commands execute using argument arrays (no shell string interpolation) with strict execution timeouts.
- Isolated Worktrees: Code builds and experiments run inside detached Git worktrees created via
git worktree add --detach, keeping the main repository clean. - Patch Scope Verification: Proposed patches are checked with
git apply --checkand rejected if they touch files outside the original Git diff hunk or contain secret tokens.
10. Honest Limitations & Known Trade-Offs
To maintain complete technical credibility, the engineering team notes the following current constraints:
- SigNoz Account Dependency: Telemetry-backed verification and
SHIPverdicts require valid SigNoz OTLP ingestion credentials and an accessible SigNoz MCP endpoint. Without them, TraceForge safely defaults toNEEDS_REVIEW. - Single-Machine Loopback Timings: The empirical benchmarks reported were recorded on single-machine loopback interface setups. Absolute latencies are hardware-dependent, though regression classifications reproduce reliably across runs.
- Closed-Loop k6 Schedules: Current load plans rely on ramping-VUs schedules. Open-model arrival-rate load generation is planned for future releases.
- Dashboard Write Permissions: Publishing native SigNoz dashboards requires an editor/admin API key; standard read-only keys used for telemetry investigation cannot publish dashboards.
11. Getting Started & Execution Guide
To run TraceForge locally against the included instrumented demo repository:
# 1. Environment configuration
Copy-Item .env.example .env

# 2. Synchronize Python dependencies & verify doctor health
uv sync --all-extras
uv run traceforge doctor

# 3. Bootstrap target demo git scenarios
uv run python scripts/bootstrap_demo_repo.py

# 4. Execute SQLite write-lock demo scenario
uv run traceforge demo lock --profile demo
Explore the TraceForge Repository
Review full source code, state machine tests, OpenTelemetry integrations, and raw benchmark records on GitHub.
View Repository on GitHub